Pipeline Profiling Processors
Pipeline: It’s a sequence of processes that executes in a defined order to perform the task into Sitecore. In Sitecore, there is a number of inbuild pipelines and we add our custom pipelines into that. We can change the order of the pipelines as per our requirements.
When we write our custom pipelines then it’s difficult to find out on deployment environment that it's executing or not. To check the sequence of execution there is a good feature provided by Sitecore is the Pipeline Profiler.
The pipeline admin page is used to view all the pipeline processors that are defined into the Sitecore and the sequence in which they will execute.
By default, The pipeline Profiler page is disabled, and you need to enable it manually.
To enable Pipeline profiling, perform the below listed steps:
- Add the following key <add key="env:define" value="Profiling" /> to Web.config <appSettings> section.
- Login into the Sitecore Instance.
-
Go to the Pipeline.aspx page from the below URL:
https://{Sitecore Instance}/sitecore/admin/pipelines.aspx
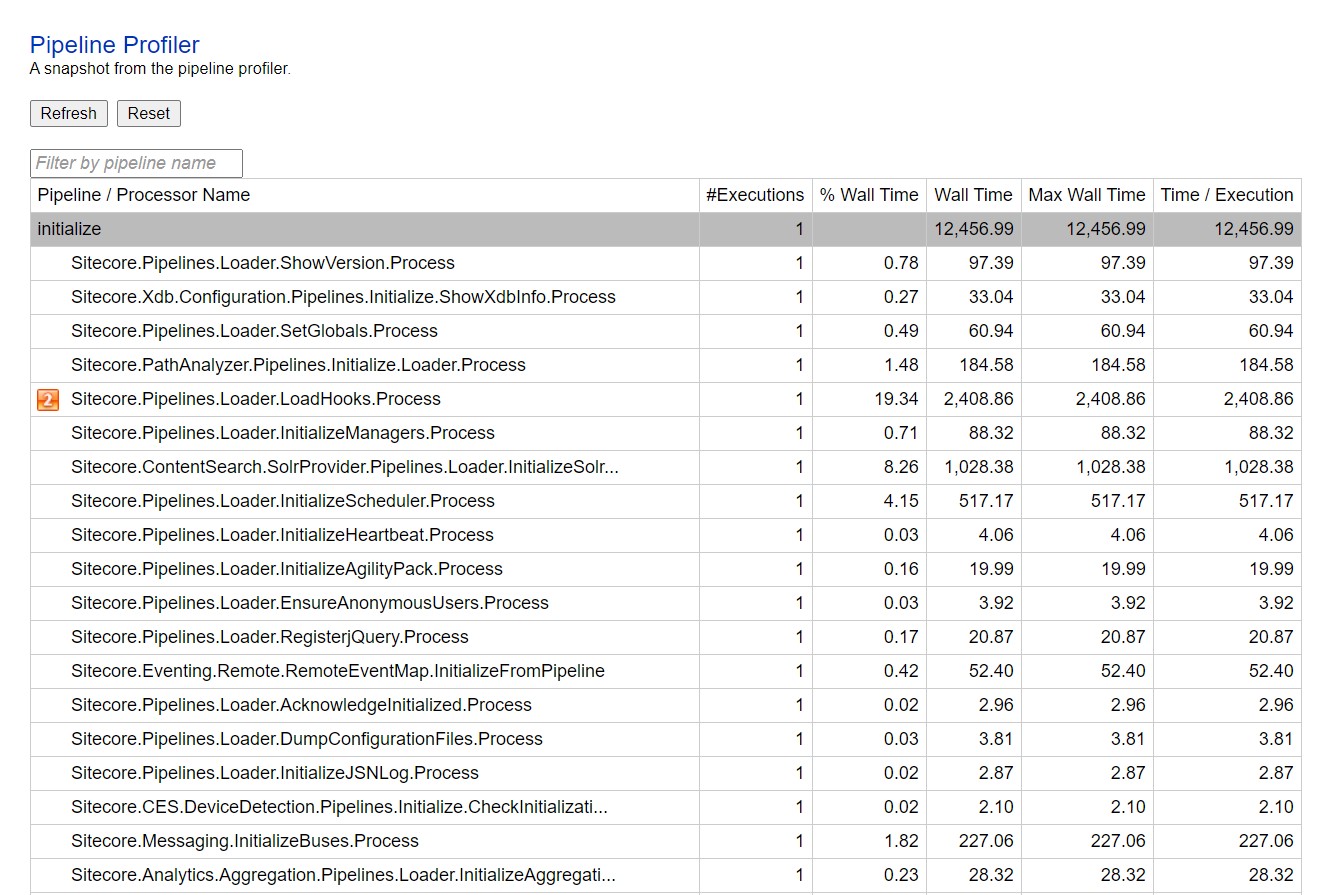
Once you perform the above steps you can find your pipeline profiling page as below:

To measure CPU usage during pipeline profiling, set the value of the Pipelines.Profiling.MeasureCpuTime setting to true. Measuring CPU usage adds a performance overhead to the pipeline but provides additional information about the behavior of the processors.
% CPU: For a processor, the percentage of total pipeline CPU usage that is spent executing this processor
Definition of the Terms:
- #Executions: The number of executions of the pipeline or processor
- % Wall Time: For a processor, the percentage of total pipeline execution time that is spent executing this processor
- Wall Time: Total wall time spent in all executions of the pipeline or processor
- Max Wall Time: Wall Time of the longest execution of a pipeline or processor
- Time / Execution: Average time taken by a single execution of the pipeline or processor (wall time)
Happy Sitecoreing 😊


Comments
Post a Comment