Sitecore Debugger
After successful implementation of the Sitecore project, page performance comes into the picture in the context of page load time, slowness of page, or rendering. There are many tools available online to investigate the website performance like PageSpeed Insights, JMeter, GTmetrix, Lighthouse, etc., but Sitecore provides its own tool for troubleshooting the Sitecore performance issue i.e., Sitecore Debugger.
“If you don’t have a fast website, users will bounce faster you can say. Google recommended page load time is under two seconds, However, speeding up your website is no easy task.”- Google
This tool finds out the problems related to slow rendering, and pipeline time is taken and provides the other details for rendering like data source, parameter, Profile, cache setting, output, etc. The debugger facilitates developers to scrutinize the output of both the rendering and the entire page. So that developer can take care of page performance issues while developing the component and it will not affect the performance of the website in the future.
There are several ways to Open a Page in Debugger:
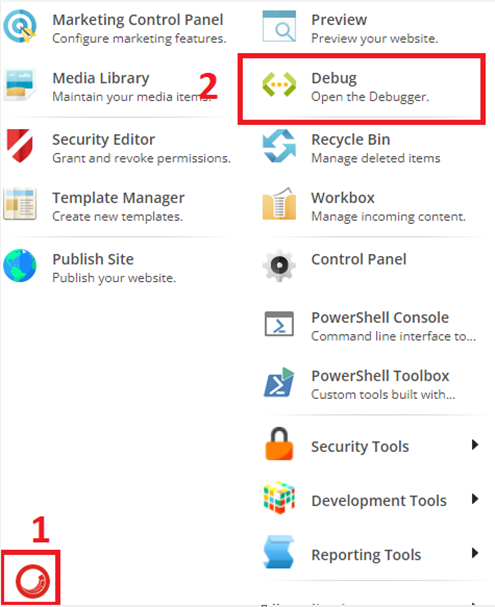
- Sitecore Desktop Icon – by default it will open the home page.
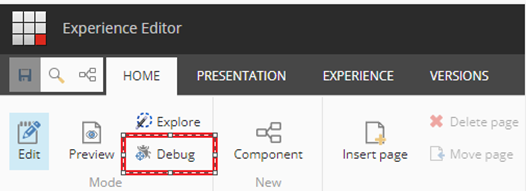
- Sitecore Experience Editor – Choose a page from the content editor and open it in experience editor mode. Select the debug option under the Home menu in the ribbon bar.
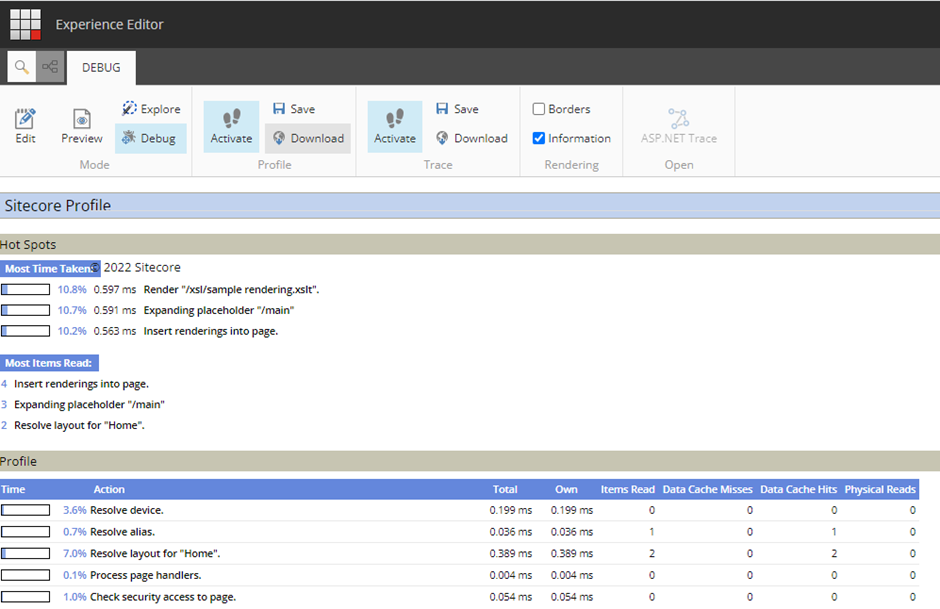
Once you open the page in debug mode and scroll down the page you will find some helpful information like where the most time is taken, and the most items read. It’s also useful to find which rendering and pipelines take too much time to load.
There are several options available in the Debugger window ribbon bar:

- Mode: By default, it's set to Debug mode. You can change it to Edit, Preview, and Explore mode as well.
- Profile: By default, it's activated. You can disable it by choosing the option Activate. If it’s not selected, then you will not be able to see the profile information on the scroll down of the page. It will give you detailed information about the time taken by action, rendering, and placeholder. You can also download and save the profile information in XML format.
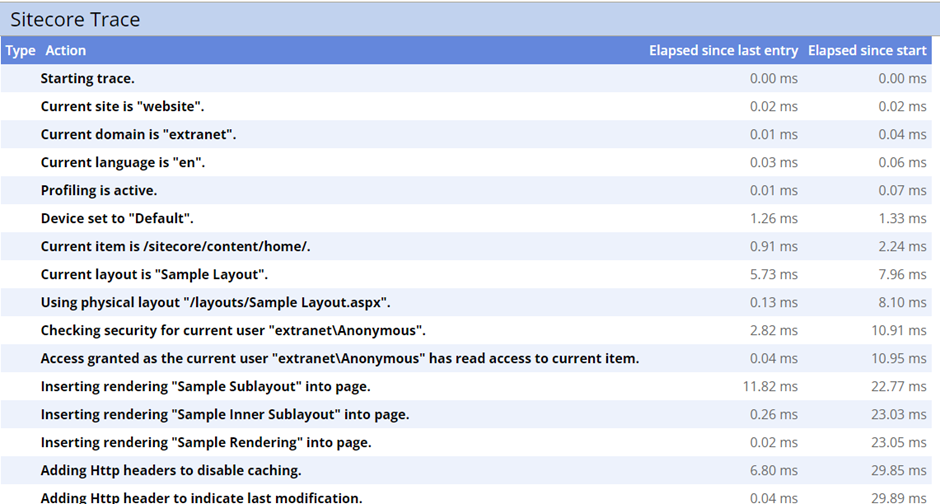
- Trace: It is also activated by default. It gives you more information about the Sitecore page generation steps in sequence like pipeline execution. You can also download and save the detailed information for more investigation. Again, you can also disable this option and once you unselect it will not provide you the information after scrolling down the page.
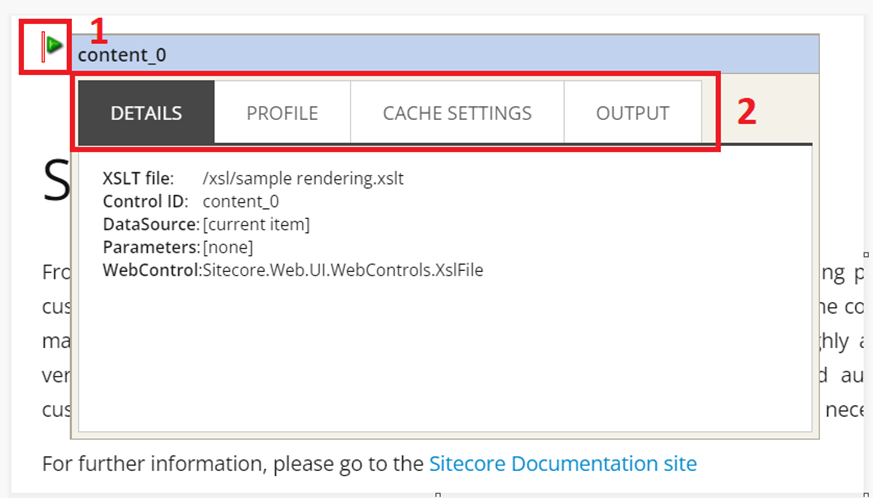
- Rendering: It will give you detailed information about the particular rendering in a popup after hovering a mouse on the arrow icon. You can enable or disable this arrow icon by selecting the information checkbox. In the popup, it will give you the information about rendering Details, Profile, Cache Settings, and Output.
- Open: When this option is selected it will open the ASP.NET application trace in a new window.
When you scroll down the page you find the below options:
- Sitecore Profile: It provides the trace summary along with cache usage information.
- Most Time Taken: Indicates three actions that were the longest to execute.
- Most Items Read: The Most Items Read section shows three actions that caused the biggest number of requests to other items.
-
Profile: The Profile contains the summary of all actions executed
during the rendering of the page and the cache hit rate. Below is the
explanation of the Profile’s columns:
- Time: The percentage of time required to render the entire page required to complete a particular action.
- Action: A description of the particular action.
- Total: The total execution time in milliseconds.
- Own: The execution time of the item itself, not including the renderings triggered by it, in milliseconds.
- Items Read: The number of Sitecore items read during the execution of a particular rendering. This information should give a hint why some rendering takes so long to execute or help to detect a non-working query.
- Data Cache Misses: Indicates how many times the action was requested and not found in the cache.
- Data Cache Hits: Indicates how many times the action was requested and found in the cache.
- Sitecore Trace: Sitecore Trace contains detailed information about the actions performed during the page rendering.

Happy Sitecoreing 😊


Comments
Post a Comment